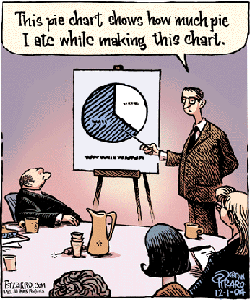
This week in Maths we are looking at Pie Charts.
A pie chart is a circular chart divided into sectors, each sector shows the relative size of each value.
There are many resources available, here is a website where you can create your own pie chart.
Links follow:
- A good explanation given in a narrative style is found here.
- An online lesson plan with links to resources.
- An interesting lesson starter comprised of an estimation question.
- A good downloadable worksheet with answers is located here.
On Tuesday we were looking at some more advanced calculations for Stage 3, and the BBC Bitesize Maths website has some good supporting activities.
